1/25/12

Lost and Found, for the Critical Reflection


This animation is based on the children book of Oliver Jeffers, and produced on Christmas eve in 2008.

It's about a small boy and a naughty penguin. One day, a penguin show up in the boy's house. The kindhearted boy thought it has lost its way, so he made a boat and try to help it to go back home. After a lot of difficulty, they reached the south pallor and say goodbye. Then they realized they have became part of each other's life and decided to be together as friends.

As for the characters, he boy is cool, kind hearted and smart. So we didn't see much facial expression and dialogue. The penguin is curiosity and lonely, and kind. And we can see a lot of action and facial express. But of cause, it did not talk, it looks like that it has the feeling and thinking like human.

This animation can remind all of us the style of Oliver Jeffers's children book.The color of the background is warm and relax, and the technical part of the water is also impressive.

It's a story that tells you a lot. Some people lost, some people found. In the world of friendship, we found each other. So we should try not to lose each other so easily.

12/8/11

Some Clothing Made with Illustrator

After reading the book The Fashion Designer's Directory of Shape and Form, I tried to create some of the clothing in the book by Illustrator. 

During the process, I thought the life drawing classes do me a great favor, because it gave me the sense of the scale and line of dress according to the human body. And the reflect transfer function of Illustrator also helped me a lot.
Skirt

Top

trousers

12/4/11

Context & Method for Jeanette's Module

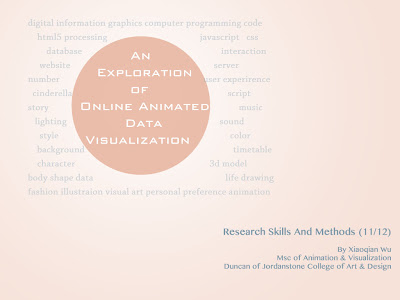
The cover of the powerpoint
Title: An  Exploration of online animated data Visualisation

The Research Problems:

    • How to make data easier to understand by visualization?
    • Can data visualization be animated instead of just static display?
    • How to apply the new computer technology to create better data visualization?

Context:

Data visualization is the study of how to communicate information in a clear and effective way by graphic methods(Fry+Oram, 2007).

We are living at an information explosion time, but to many non-professionals, so much data is a disaster because they are hard to read and understand. Most of the time, people are trying to understand the meaning of the data instead of the numbers. That's why we need visual design to help the public to get the content of the data.

As for the exploration of data visualization, traditional visual artist like Woolman argued that 'The root of information visualization is in graph drawing'(Woolman,2002); This focus on static graphic method certainly help people to understand the relationship and meaning of the data, but it's not flexible enough to represent the change of the information if its data is dynamic.

Ben Fry, who is a consultancy of design and software,  proposed another theory for this kind of visualization. He stressed the importance of the interaction and change between data and users. Base on this theory, he summarized seven steps of data visualization, which are “acquire-parse-filter-mine-represent-refine-interact”(Fry,2007). These steps provided a very practical method of data display and also the possibility to allow user to communication with the data.

In the case of this project, which aimed at using the story background of Cinderella to build an online data visualization website, with the new technique HTML5 to draw the canvas, also involve Maya 3D modeling and 2D drawing, the seven-steps-method  that Fry suggested is inspiring; it somehow involves all the needs and stakeholders through the visualizing process, and it's easy to reuse in other visualization cases, such as an online HTML5 information animation.


Outcome:

Aimed at helping people understand themselves better by interacting with certain data, this project focuses on the data relative to personal interest. The outcome should be easy to access and simple to operate, and suitable for a planned online animated data visualization website.

The research and practice are relative to the areas of visualization, fashion and computer programming.

Research Methods:

The research will use the following research methods:

    • Storyboard, which will simplify the data to be presented and clarify how to visualize it;
    • Visual diary, which will be helpful to collect inspiration and build up the visualization ideas;
    • Computer simulation, which will permit experiments to understand the possibility and limits of the new technologies used in the project, such as Javascript and HTML5;
Timetable:
    • September - November 2011 (Program Learning of Maya and Life Drawing, Research on Technology and Fashion, Experiment on Web programming, data analysis)
    • December 2012(script and storyboard, experiment on website)
    • January - February 2012(Character Design, 3d modeling, work on the website)
    • March - June 2012(background design, animation, sound, build the website)
    • July - August 2012(music and sound, editing, coding and test of the website, poster)
Reference:
    • Ben Fry and Andy Oram (ed.) (2007) Visualizing Data. United States of America, O'Reilly Media, Inc.
    • Matt Woolman (2002) Digital Information Graphics. London, Thames & Hudson Ltd.
    • Peter Lunbbers, Brian Albers, and Frank Salim (2010) Pro HTML5 Programming:Powerful APIs for Richer Internet Application Development.  United States of America, Apress.

An Experiment on Image Sprite

I have posted a blog(Image Sprites, Easy Animation) of Image Sprite and I really like this way of animation. In this experiment, I used some open resource images of clothes from zool.com.cn and create a large image as the basic background.
The Basic Background
The Image Frame that Shown On Website
It's glad to see that this experiment go along well with most browser. Feel free to visit it and give me some suggestion.

An Experiment on Realtime Lighting

I always wanted to show light on a website in a way of realtime, which means the lighting a certain object can change according to the movement of the mouse. I read a lot of website then one day I came across an amazing solution on 29a.ch created by Jonas Wagner. Then I fellow him on Twitter and asked if I could use this technique in my project. He's so nice that he gave this permission.

The I read some of him code. What I have to do is to create two image, one is for the normal face, and then use Photoshop or other better tool to revert its color, then the javascript file will use a certain maths principle to help calculate the alpha and color of the position of the mouse above the face image.
The face image

The Reverted Image (by PS)
 In my experiment, I used a picture I took of a castle in Highland, then use Photoshop to make it looked darker and created another image as the lighting image by 'revert' tool. The experiment went good on Chrome and Safari, you may visite it by this link.
The result of this experiment

12/3/11

Something about 3D

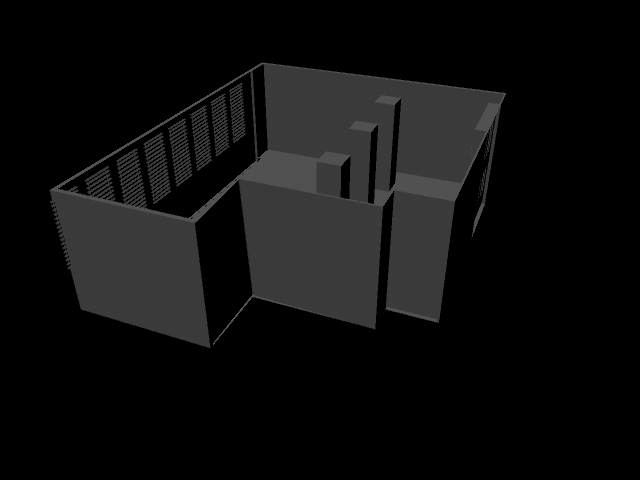
A Classroom I Created in Class, with the help of Link
This semester we had a module of 3D practice, and I learned a lot about modeling, animation, lighting, UV maps and so on. They are amazing and of great fun. But I think I still have to difficulty to transfer what I see as 2d to a 3d model, and it's hard for me to image what they look like and how then move from different angles. This's what have trouble me since I was doing 3D computer games with OpenGL in my undergraduate. So it's possible that I would avoid using Maya for my project.

Set Proportions by stylepilot.com
So when once Thomas recommended a website named stylepilot which used Flash to allow the users to changed the body shape on stylepilot.com, I began to think that maybe I could prepare a series of images and display one of them as the users change the data. That means I could do the scale or other changes with computer techniques like Python or Js online.


And if this doesn't work out, I shall try the online 3D technique name WebGL, which allow you to do a lot of changes to 3D object in realtime online. It's similar to OpenGL that I'm familiar with, but it's still under development and the coding is very complexity.

By the way, I saw some video about 123D of AutoDesk, I think it's a helpful tool for me to build models of different body shape if I just have to take some photo of people.