Showing posts with label programme of study. Show all posts

8/10/12

Overview of the Project

Part I: Animation of Cinderella

Aim: Specify the user requirements with the story background of Cinderella.
Technique: ProcessingJs, HTML5, AI, PS;
Research:
1. the story of Cinderella;


2. ProcessingJs, HTML and the Coding of animation.


3. Character Design and the use of mathematics.

Part II: Magic Mirror

Aim: Visualise Susanna & Trinny's body shape dressing rules.
Technique: ProcessingJs, HTML5, AI, PS;
Research:
1. Fashion Rules;

2. Mirror.


3. Online Interaction.

Part III: Others

Practice:

The Story: Orignal Cinderella and Movies


Talking about the story background of the project, Sharon suggesting me to read the original version of Cinderella's story. So I looked up the story on the internet and found some very interesting elements that I'm glad to use in my own project.

One is the pigeons who helped Cinderella to alight amongst the ashes. In the story, it's said that "(birds)odded with their heads and began pick", singing "The good into the pot,The bad into the crop." In my project, I simplified them into three chicks talking about Cinderella's wish.

Also in the story, there's a hazel-tree helping Cinderella when she begged "Shiver and quiver, my little tree,Silver and gold throw down over me". Here I drew 3 tree in the farm who can wave there leaves when them heart Cinderella's words.

I also watched Andy Tennant's Ever After: A Cinderella Story (1998). What impressed me was that her two sister didn't have to be ugly or really so bad. It's that they were so beautiful and proud made Cinderella think the ball will be a place to find happiness. So in my project I showed two girls dressed up with really glamour.

Reference:
1. Cinderella by The Brothers Grimm, translated by Margaret Taylor (1884)(http://classiclit.about.com/library/bl-etexts/grimm/bl-grimm-cinderella.htm);
2. Ever After: A Cinderella Story (1998)(http://www.youtube.com/watch?v=Hcj9fyx6DXI;

5/17/12

A New Visual Language: Storytelling

For the last 2 supervisor meeting, Mr O'Neill and I spent a long time discussing what's the relationship of the data visualization and animated interaction part in my project. It's really confusing that why we need this kind of visualization in a fashion adviser website.  So when I find Klanten's book named Visual Storytelling in the library, it really opened my mind.

This new language suggested that there are always questions and curiosity after when audience see the data, these feelings come from their experience of life. And there are also many pieces of funny historical information behind the changing data. If we could introduce the information through some well-known stories, it will help to pass understanding and involve emotion. "The essence of visual storytelling is this combination of emotional reaction and narrative information. "(Andrew Losowsky). Moreover, through the idea of story telling, it's more effective to gather images and interactive design to express the visual concept.

So my goal is to tell the story behind the dresses we show or the choice we made. For example, the style we write for the story by choosing different color or the history of the evening dresses over the past 100 years.


Reference:
R. Klanten (2011) Visual Storytelling: Inspiring a New Visual Language. London, Gestalten.


4/2/12

The First Script & Storyboard and Advice from MAV

Storyboard:

Storyboard Version 1.0

Script:

Characters: Cinderella, Two Stepsisters, Fairy Godmother, Prince Smarmy
Part I: A Small Animation About Cinderella
Cinderella watched her two stepsisters leaving the house, disappeared in the door.
Cinderella: Oh, I really wished to go to the party. All I want is one night, a wonderful evening which is different and happy.
She looked at her grey dress sadly.
Suddenly, the Fairy Godmother appeared with a sparkle.
Fairy: Poor girl, come on, I can help you go to the ball.
Cinderella: But I don’t have an evening dress.
Fairy: I can make one for you. What kind you dress do you want?
Cinderella (said in hesitate): I don’t know. Maybe something like the one my sister dressed tonight?
Fairy: I am worry that style might not fit in you. 
Cinderella: I’m sorry but I really have no idea. I have never go to a ball before.
Fairy (took out a magic mirror): Don’t worry. Just tell me some data about your self? This magic mirror will tell you what you should wear and make you beautiful.
Part II: Data Interaction
Cinderella: Magic Mirror on the wall, what should I wear tonight?
Mirror: I can help you if you tell me your body shape?
(Show several body shapes on the mirror that you can choose)
Cinderella choose the “unknown” option.
Mirror: Well, don’t worry. Just tell me some data of yourself?
Using a fairy stick with sparkle to draw a line on Cinderella’s shoulder, bust, waist, and rise. After each measurement, you can enter the data.
Show the result of the body shape.
Mirror: Good job, now could you tell me the color of your skin and hair?
(Show a color board to choose from.)
Mirror: Hmm, and tell me where you are going to meet you princess tonight?
(Show some occasion.)
Mirror: Great, here’s some advice for you, want to try them on?
(Show several clothes)
Cinderella picked one(in fact, the user did this)
Cinderella got dress and turn around.
(3 Options: 1.Fantasy, exactly what I want; 2. Well, I’m not sure; 3.Oh, I hate it!)
1. Cinderella went with the pumpkin car happily. Then asked the user “do you want to know what most pretty women choose nowadays? If yes, show the data visualization part.
2. Cinderella can watch the data visualization part, or do a test about personal interest, or do a test about the person she is going to me tonight, then get more advice and choose another dress.
3. Cinderella kicked the mirror and choose another dress or do more test.
Mirror: Would you like to tell me your name and a key password so that I can remember you?
Part II: Data Visualization.
Do some visualization effect from the data of the website user and other data about fashion interest.
Context:
Women’s favorite color over the past 10 years;
Dresses over the past 100 years;
Hair styles over the past 100 years;
Classify Data: traditional chart, the tree structure-data, the mesh and relational data, the mutative process data, the sub-category data, the timeline data, the heat map-data, the thematic data, the mutative process data.

Advice:

From Peer Review:
For the dress part, there are still too many models to draw, so maybe I should reduce the animation in this part;
The drawing style seemed much too like a wedding style, I should stand on the water color style I imagined in the beginning.
The animals in the storyboard seemed to be a good idea for interaction. Maybe I should do more in the part.
I should make more connection with the social networks or companies like facebook or ebay.
What's lucky for me is that I could get a lot of help from my classmates.

From my Supervisor Mr. O'Neill:
Cindy has moved forwards with a first attempt at a storyboard for her interface designs. This has been very helpful in supporting discussions about how to develop her ideas. Cindy should continue to develop the story board more fully working through various iterations of her design ideas. This process should help in planning out how things will work in her final project.
 The final project will be completed using processing.js and be delivered as a web based interface.

From Sharon:
The house should be bigger base on the story. For the dressing part, I could learn something from the children's dressing-up book.
For style suggestion, I could ask for some advice from Dan and Ms. Stevenson, who are good at fashion.

12/4/11

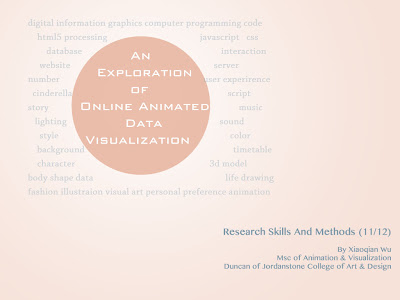
Context & Method for Jeanette's Module

The cover of the powerpoint
Title: An  Exploration of online animated data Visualisation

The Research Problems:

    • How to make data easier to understand by visualization?
    • Can data visualization be animated instead of just static display?
    • How to apply the new computer technology to create better data visualization?

Context:

Data visualization is the study of how to communicate information in a clear and effective way by graphic methods(Fry+Oram, 2007).

We are living at an information explosion time, but to many non-professionals, so much data is a disaster because they are hard to read and understand. Most of the time, people are trying to understand the meaning of the data instead of the numbers. That's why we need visual design to help the public to get the content of the data.

As for the exploration of data visualization, traditional visual artist like Woolman argued that 'The root of information visualization is in graph drawing'(Woolman,2002); This focus on static graphic method certainly help people to understand the relationship and meaning of the data, but it's not flexible enough to represent the change of the information if its data is dynamic.

Ben Fry, who is a consultancy of design and software,  proposed another theory for this kind of visualization. He stressed the importance of the interaction and change between data and users. Base on this theory, he summarized seven steps of data visualization, which are “acquire-parse-filter-mine-represent-refine-interact”(Fry,2007). These steps provided a very practical method of data display and also the possibility to allow user to communication with the data.

In the case of this project, which aimed at using the story background of Cinderella to build an online data visualization website, with the new technique HTML5 to draw the canvas, also involve Maya 3D modeling and 2D drawing, the seven-steps-method  that Fry suggested is inspiring; it somehow involves all the needs and stakeholders through the visualizing process, and it's easy to reuse in other visualization cases, such as an online HTML5 information animation.


Outcome:

Aimed at helping people understand themselves better by interacting with certain data, this project focuses on the data relative to personal interest. The outcome should be easy to access and simple to operate, and suitable for a planned online animated data visualization website.

The research and practice are relative to the areas of visualization, fashion and computer programming.

Research Methods:

The research will use the following research methods:

    • Storyboard, which will simplify the data to be presented and clarify how to visualize it;
    • Visual diary, which will be helpful to collect inspiration and build up the visualization ideas;
    • Computer simulation, which will permit experiments to understand the possibility and limits of the new technologies used in the project, such as Javascript and HTML5;
Timetable:
    • September - November 2011 (Program Learning of Maya and Life Drawing, Research on Technology and Fashion, Experiment on Web programming, data analysis)
    • December 2012(script and storyboard, experiment on website)
    • January - February 2012(Character Design, 3d modeling, work on the website)
    • March - June 2012(background design, animation, sound, build the website)
    • July - August 2012(music and sound, editing, coding and test of the website, poster)
Reference:
    • Ben Fry and Andy Oram (ed.) (2007) Visualizing Data. United States of America, O'Reilly Media, Inc.
    • Matt Woolman (2002) Digital Information Graphics. London, Thames & Hudson Ltd.
    • Peter Lunbbers, Brian Albers, and Frank Salim (2010) Pro HTML5 Programming:Powerful APIs for Richer Internet Application Development.  United States of America, Apress.

12/3/11

Two Tutorial Meeting of This Semester

Tutorial Meeting @21-11-2011
Mr. O'Neill and I had two tutorial meeting this semester, which were really inspiring and helpful to me.

For the first meeting, I introduced my intention of the project, and listed the techniques such as HTML5 that I would used. Then Mr. O'Neill helped me to sort out my mind and we discuss the data I were going to use. We decided to concentrate on color, body shape and occasions. He suggested me to do some research on fashion and dig into this factors and so I did.

 For the second meeting, we talked about the result of my fashion research and my website. Then he show me a website of women's body shape in their eyes. We also discussed some detail of how to get data from the users, and set up a plan for my project in the next month.